


A multi-GAAP group, consolidated step by step.
Apex Holdings Inc. reports under US GAAP in US dollars. Its subsidiaries report under Ind AS in rupees and SFRS(I) in Singapore dollars. Follow the consolidation from trial balances to the consolidated income statement, and check every figure.
A 30-minute walkthrough with the team that builds FinConso.
- 3 entities, 3 currencies, 3 frameworks
- 1 multi-GAAP adjustment, 1 intercompany difference
- Every figure reconciles
| Entity | Currency | Framework | Accounts | Mapped | Status |
|---|---|---|---|---|---|
| Apex Holdings Inc. | USD | US GAAP | 142 | 142 | ✓ |
| Apex India Pvt Ltd | INR | Ind AS | 386 | 386 | ✓ |
| Apex Asia Pte Ltd | SGD | SFRS(I) | 211 | 209 | 2 to map |
Define the group
Apex Holdings Inc. (United States) reports under US GAAP in US dollars. It owns 100% of Apex India Pvt Ltd (Ind AS, INR) and 80% of Apex Asia Pte Ltd (SFRS(I), SGD).
| Entity | Currency | Framework | Accounts | Mapped | Status |
|---|---|---|---|---|---|
| Apex Holdings Inc. | USD | US GAAP | 142 | 142 | ✓ |
| Apex India Pvt Ltd | INR | Ind AS | 386 | 386 | ✓ |
| Apex Asia Pte Ltd | SGD | SFRS(I) | 211 | 209 | 2 to map |
Bring the trial balances in
Each entity submits its trial balance in its own currency and framework. Management fees charged by the parent are included in each subsidiary's expenses (India INR 149.4, Asia SGD 1.62).
| Entity · local currency, m | Revenue | Expenses | Profit | Opening NA | Closing NA |
|---|---|---|---|---|---|
| Apex Holdings Inc. · USD | 3.00 | (1.00) | 2.00 | n/a | n/a |
| Apex India Pvt Ltd · INR | 4,150.0 | (3,320.0) | 830.0 | 5,810.0 | 6,640.0 |
| Apex Asia Pte Ltd · SGD | 64.80 | (56.16) | 8.64 | 48.60 | 57.24 |
Align the frameworks
Apex Asia accounts for an operating lease under SFRS(I) 16. The adjustment layer restates it to ASC 842 for group reporting, without touching the local books. No material Ind AS to US GAAP differences arise in this example.
| Adjustment to US GAAP · USD m | Profit effect |
|---|---|
| Apex Asia: lease cost under SFRS(I) 16 (depreciation 0.95 + interest 0.25) | 1.20 |
| Apex Asia: single lease cost under ASC 842 | (1.10) |
| Increase in profit | 0.10 |
Translate and calculate NCI
Income and expenses at average rates, net assets at closing rates. The translation difference is the movement the reserve needs, entity by entity, and 20% of Apex Asia goes to NCI.
| Rate per USD | Opening | Average | Closing |
|---|---|---|---|
| INR | 82.00 | 83.00 | 84.00 |
| SGD | 1.36 | 1.35 | 1.30 |
| NCI in Apex Asia (20%) · USD m | Amount |
|---|---|
| Opening NCI | 7.15 |
| Share of profit (20% of 6.50) | 1.30 |
| Share of translation difference | 0.38 |
| Closing NCI | 8.83 |
| Translation reserve · USD m | India | Asia |
|---|---|---|
| Opening net assets at opening rate | 70.85 | 35.74 |
| Profit at average rate | 10.00 | 6.40 |
| Translation difference | (1.80) | 1.89 |
| Closing net assets at closing rate | 79.05 | 44.03 |
Eliminate intercompany
Management fees of 3.00 are eliminated against the matching expenses. Balances are matched; a 0.02 difference is traced to cash in transit and proposed for review.
| Balance | Counterparties | Parent | Subsidiary | Difference | Status |
|---|---|---|---|---|---|
| Management fees | Parent ↔ India | 1.80 | 1.80 | 0.00 | ✓ |
| Management fees | Parent ↔ Asia | 1.20 | 1.20 | 0.00 | ✓ |
| Receivable / payable | Parent ↔ India | 0.30 | 0.30 | 0.00 | ✓ |
| Receivable / payable | Parent ↔ Asia | 0.40 | 0.38 | 0.02 | Review |
Elimination entries · USD m
Produce and prove the output
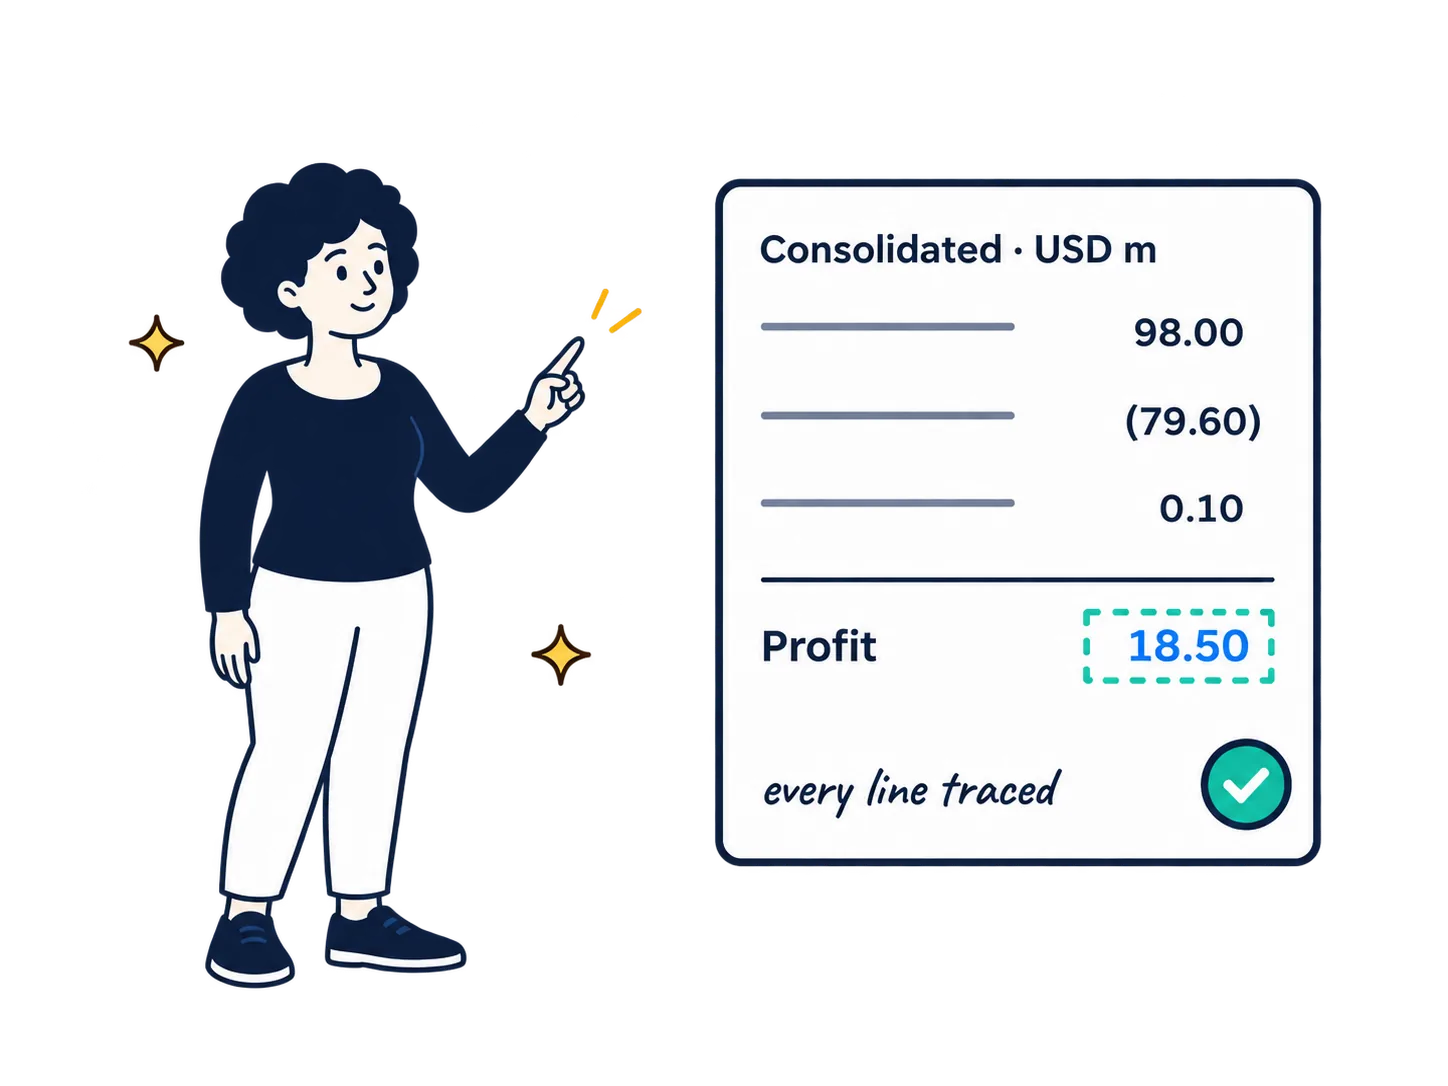
The consolidated income statement in US GAAP, with every line traceable to its source.
Select a line to see where it came from.
| Consolidated income statement · US GAAP | USD m |
|---|---|
| 98.00 | |
Apex Holdings Inc.3.00 Apex India Pvt Ltd · INR 4,150.0 at 83.0050.00 Apex Asia Pte Ltd · SGD 64.80 at 1.3548.00 Elimination E1 · management fees(3.00) | |
| (79.60) | |
Apex Holdings Inc.(1.00) Apex India Pvt Ltd · INR 3,320.0 at 83.00(40.00) Apex Asia Pte Ltd · SGD 56.16 at 1.35(41.60) Elimination E1 · management fees3.00 | |
| 0.10 | |
Apex Asia: SFRS(I) 16 cost 1.20 replaced by ASC 842 lease cost 1.100.10 | |
| Profit for the period | 18.50 |
| Attributable to owners of the parent | 17.20 |
| Attributable to non-controlling interest | 1.30 |
| Translation differences (OCI): India (1.80), Asia 1.89 | 0.09 |
| Total comprehensive income | 18.59 |
| Owners 16.91 · NCI 1.68 | |
Check the result
Everything ties.
Product demo
A 30-minute walkthrough of the consolidation workflow on a sample group, with your questions answered by the team that builds it.
- Three fields to book
- No preparation needed
- No cost, no mailing list
Structured pilot
Evaluate the real workflow on a representative sample of your own trial balances, under a mutual NDA. You keep the consolidated pack.
- One quarter, your entity structure
- Clear inputs, outputs and timeline
- No cost or commitment
Book a demo
See the consolidation workflow, from trial balance to signed statement.
A 30-minute walkthrough with the people who build FinConso.
- Entities, eliminations, translation, NCI and the multi-GAAP layer, run live on a sample group.
- Every consolidated figure drilled back to the entity and account it came from.
- Questions on IFRS, US GAAP, Ind AS or SFRS(I) answered by the team that builds the product.
- Want to test it on your own numbers? See how the structured pilot works.
Online booking opens soon.
The booking form is being set up. Please check back shortly.